© Copyright PETRONAS Dagangan Berhad 198201008499 (88222-D).
All rights reserved.
-
* Restated following adoption of MFRS 15 Revenue from Contracts with Customers
** Excluding discontinued operations and gain on disposal of subsidiaries
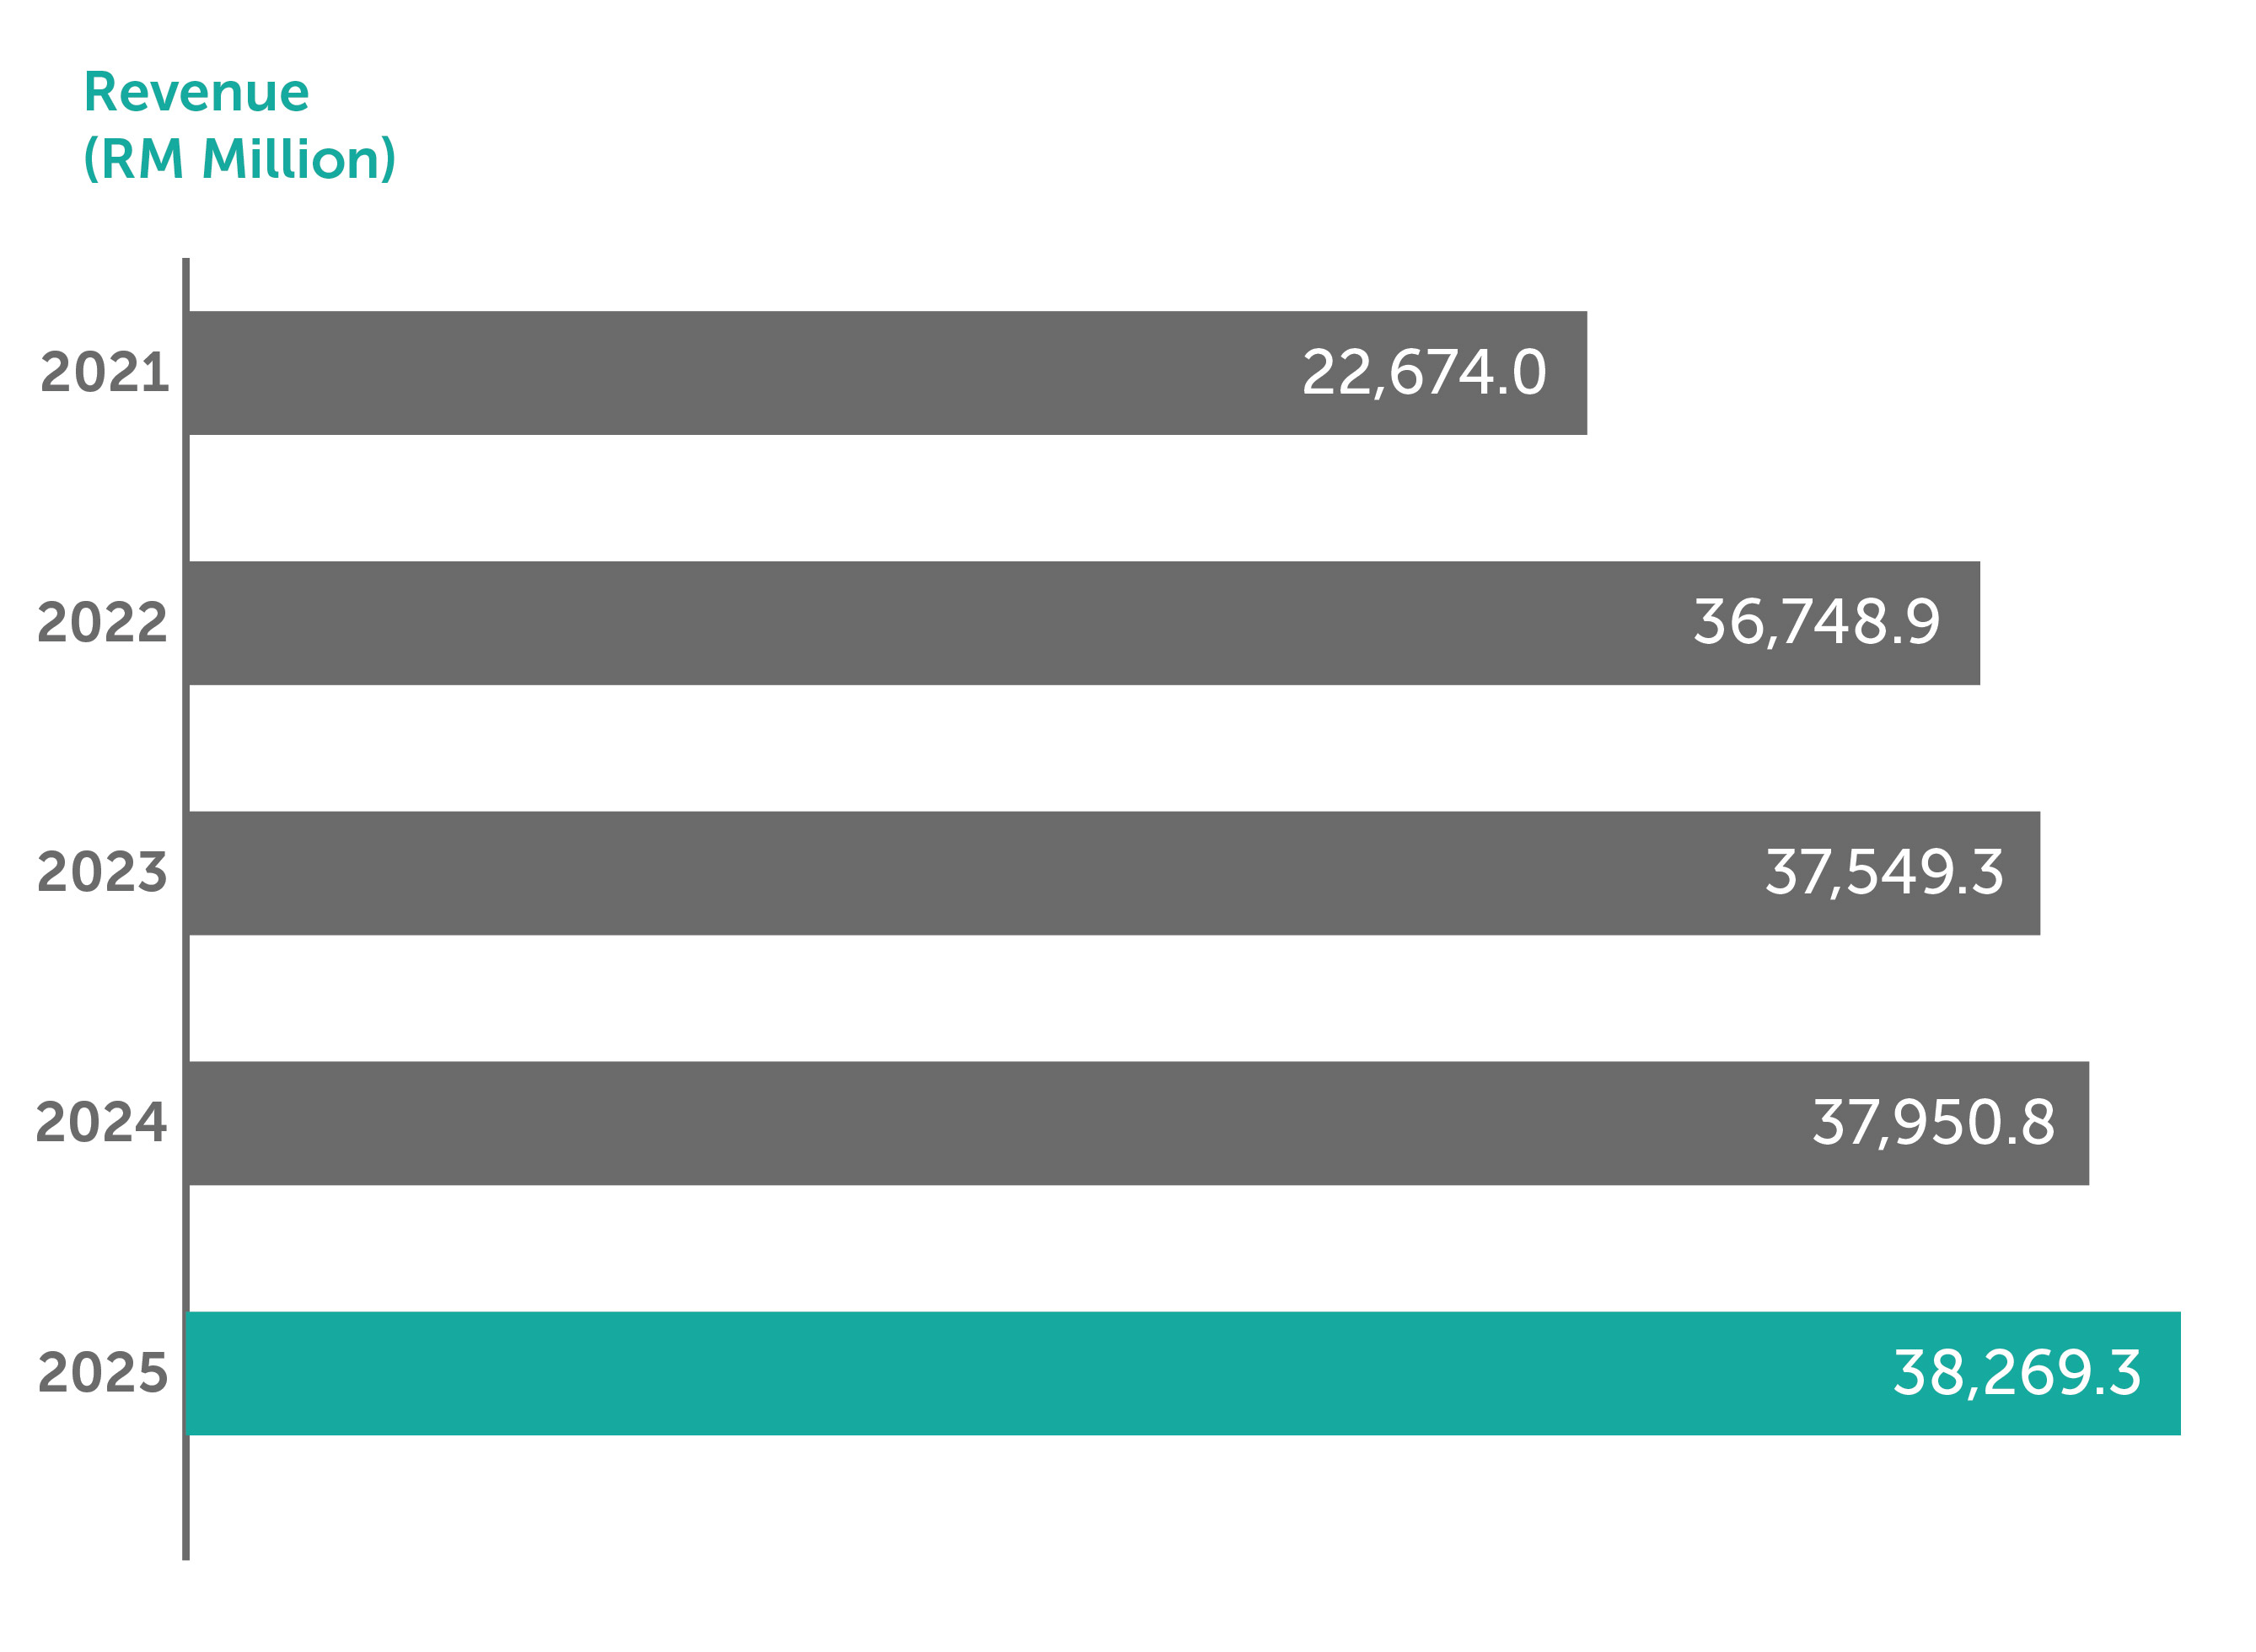
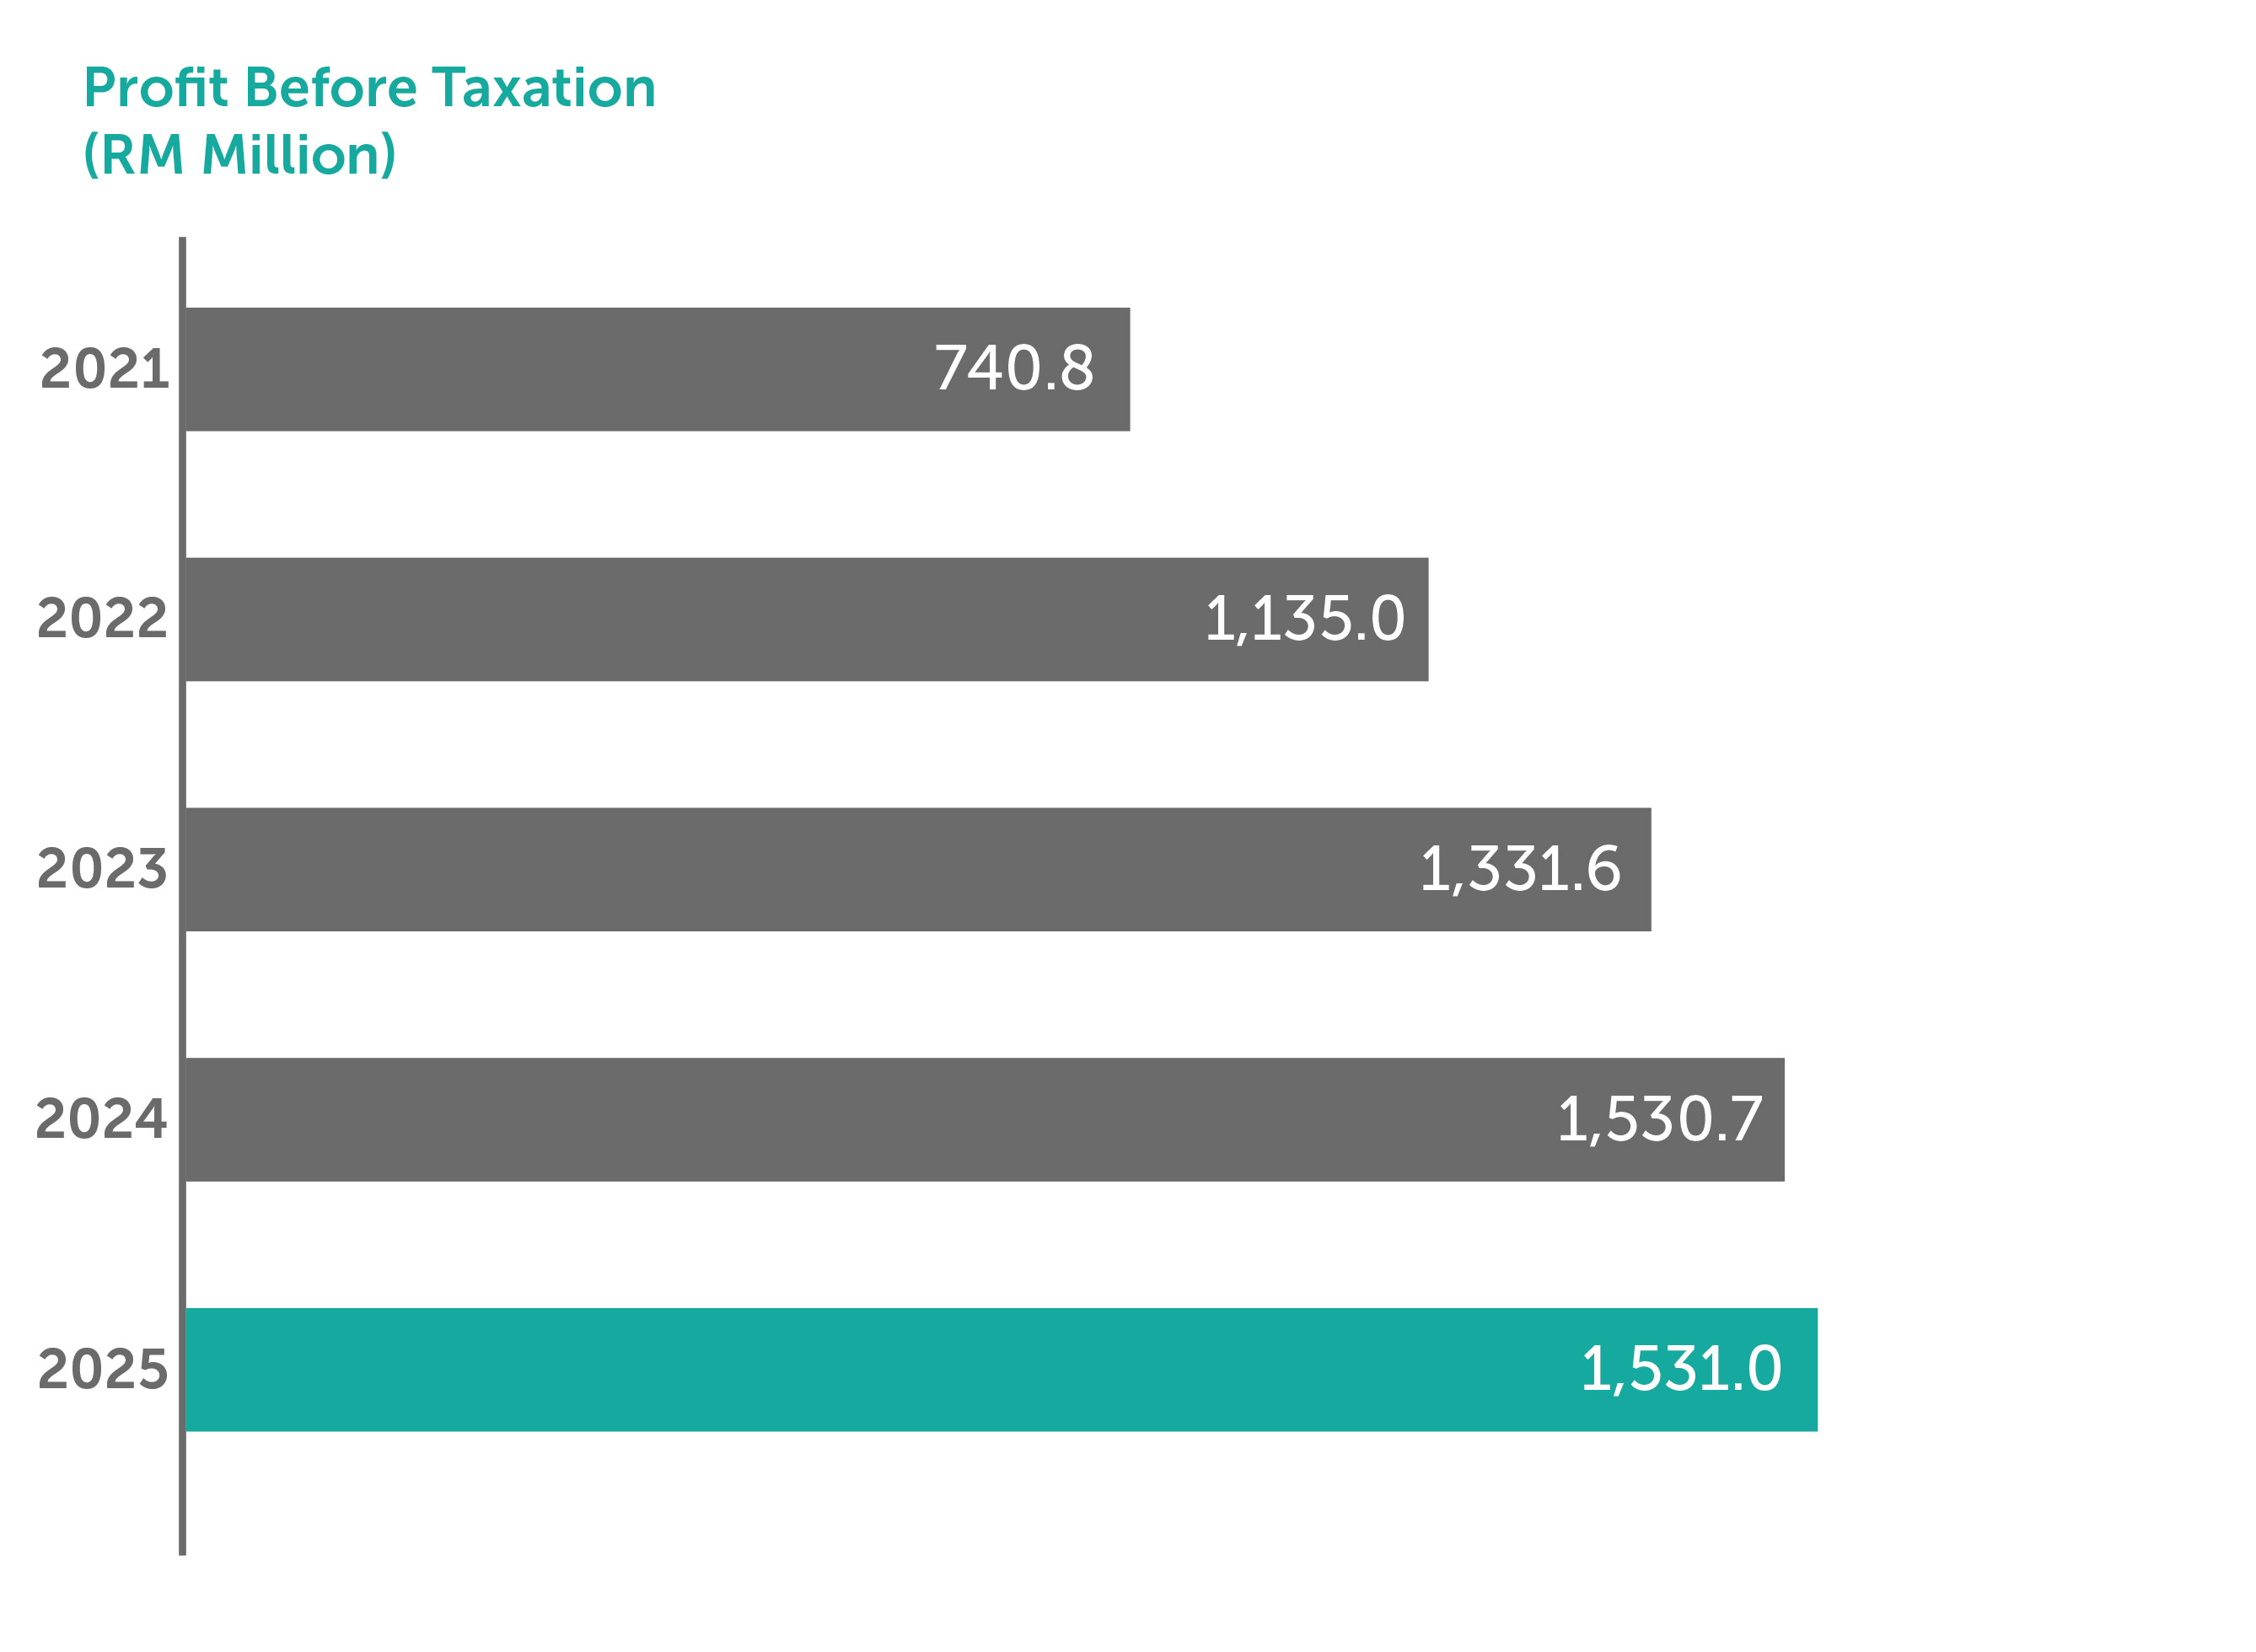
Operating Results (RM Million) FY2021 FY2022 FY2023 FY2024 FY2025 Revenue 22,505 36,749 37,549 37,951 38,269 Operating Profit 751 1,149 1,351 1,548 1,534 Profit before taxation 741 1,135 1,332 1,531 1,531 Net profit attributable to shareholders of the Company 530 777 943 1,087 1,099 Key Statement of Financial Position Data
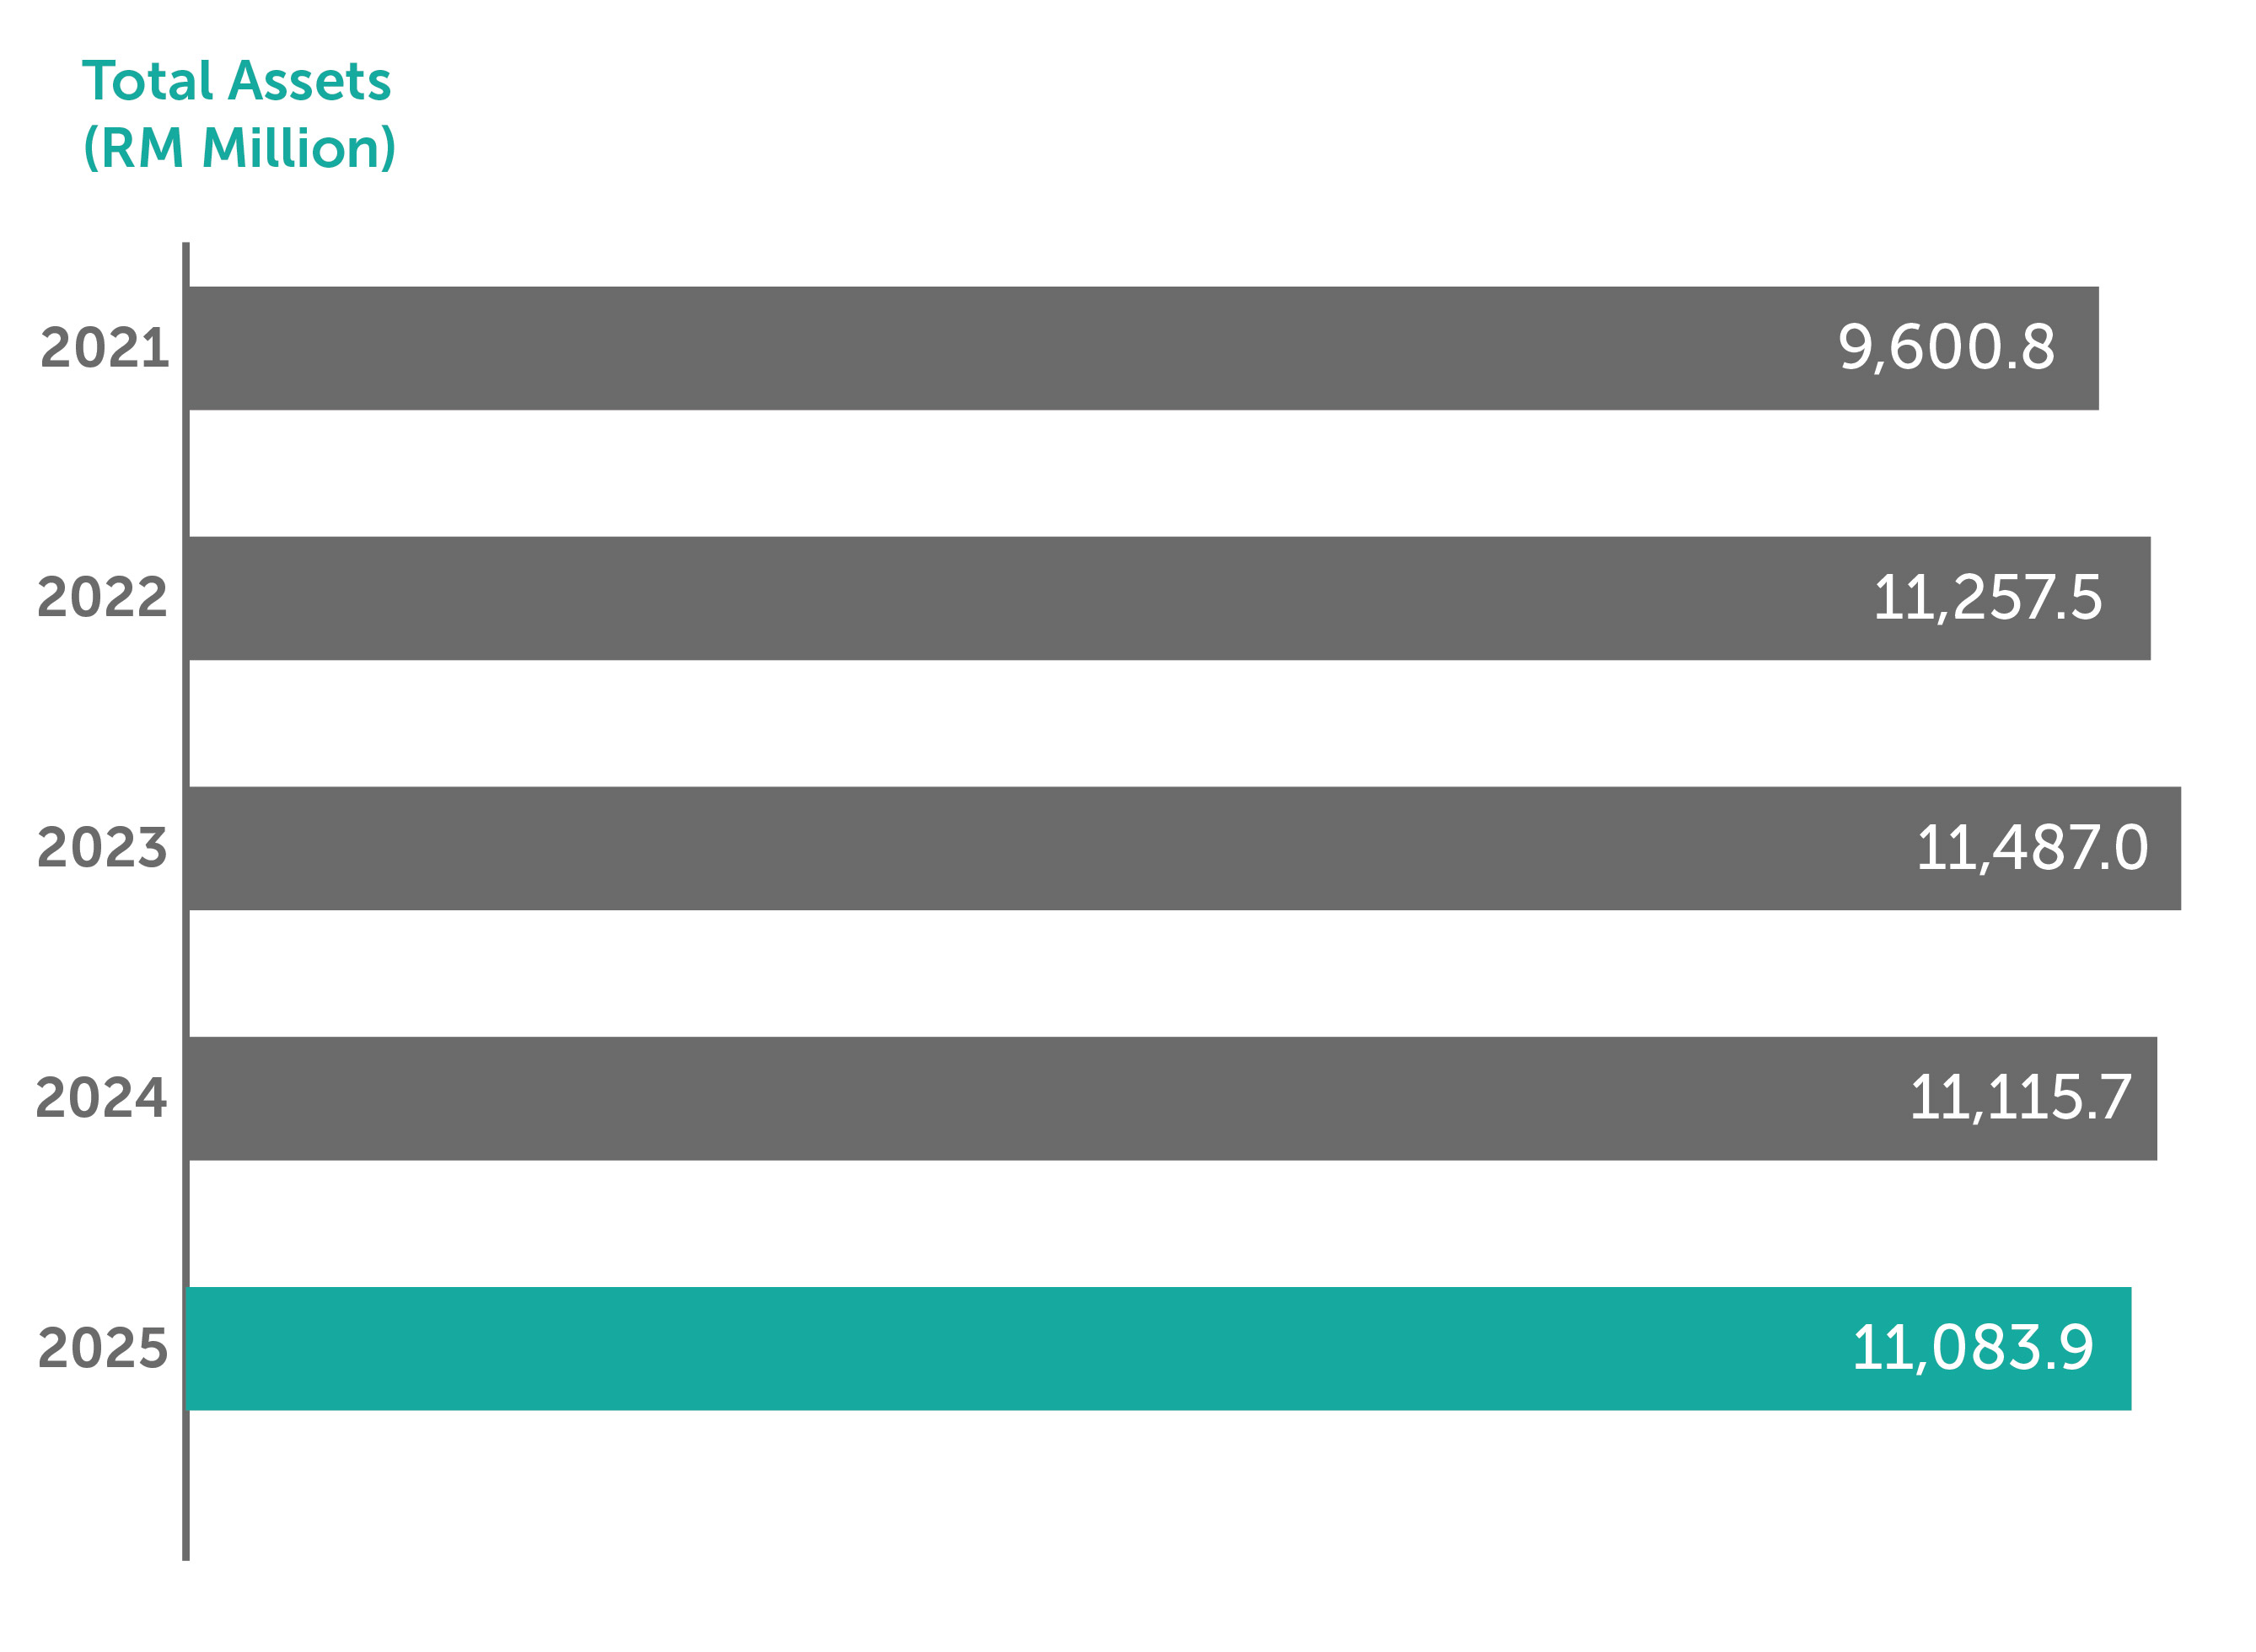
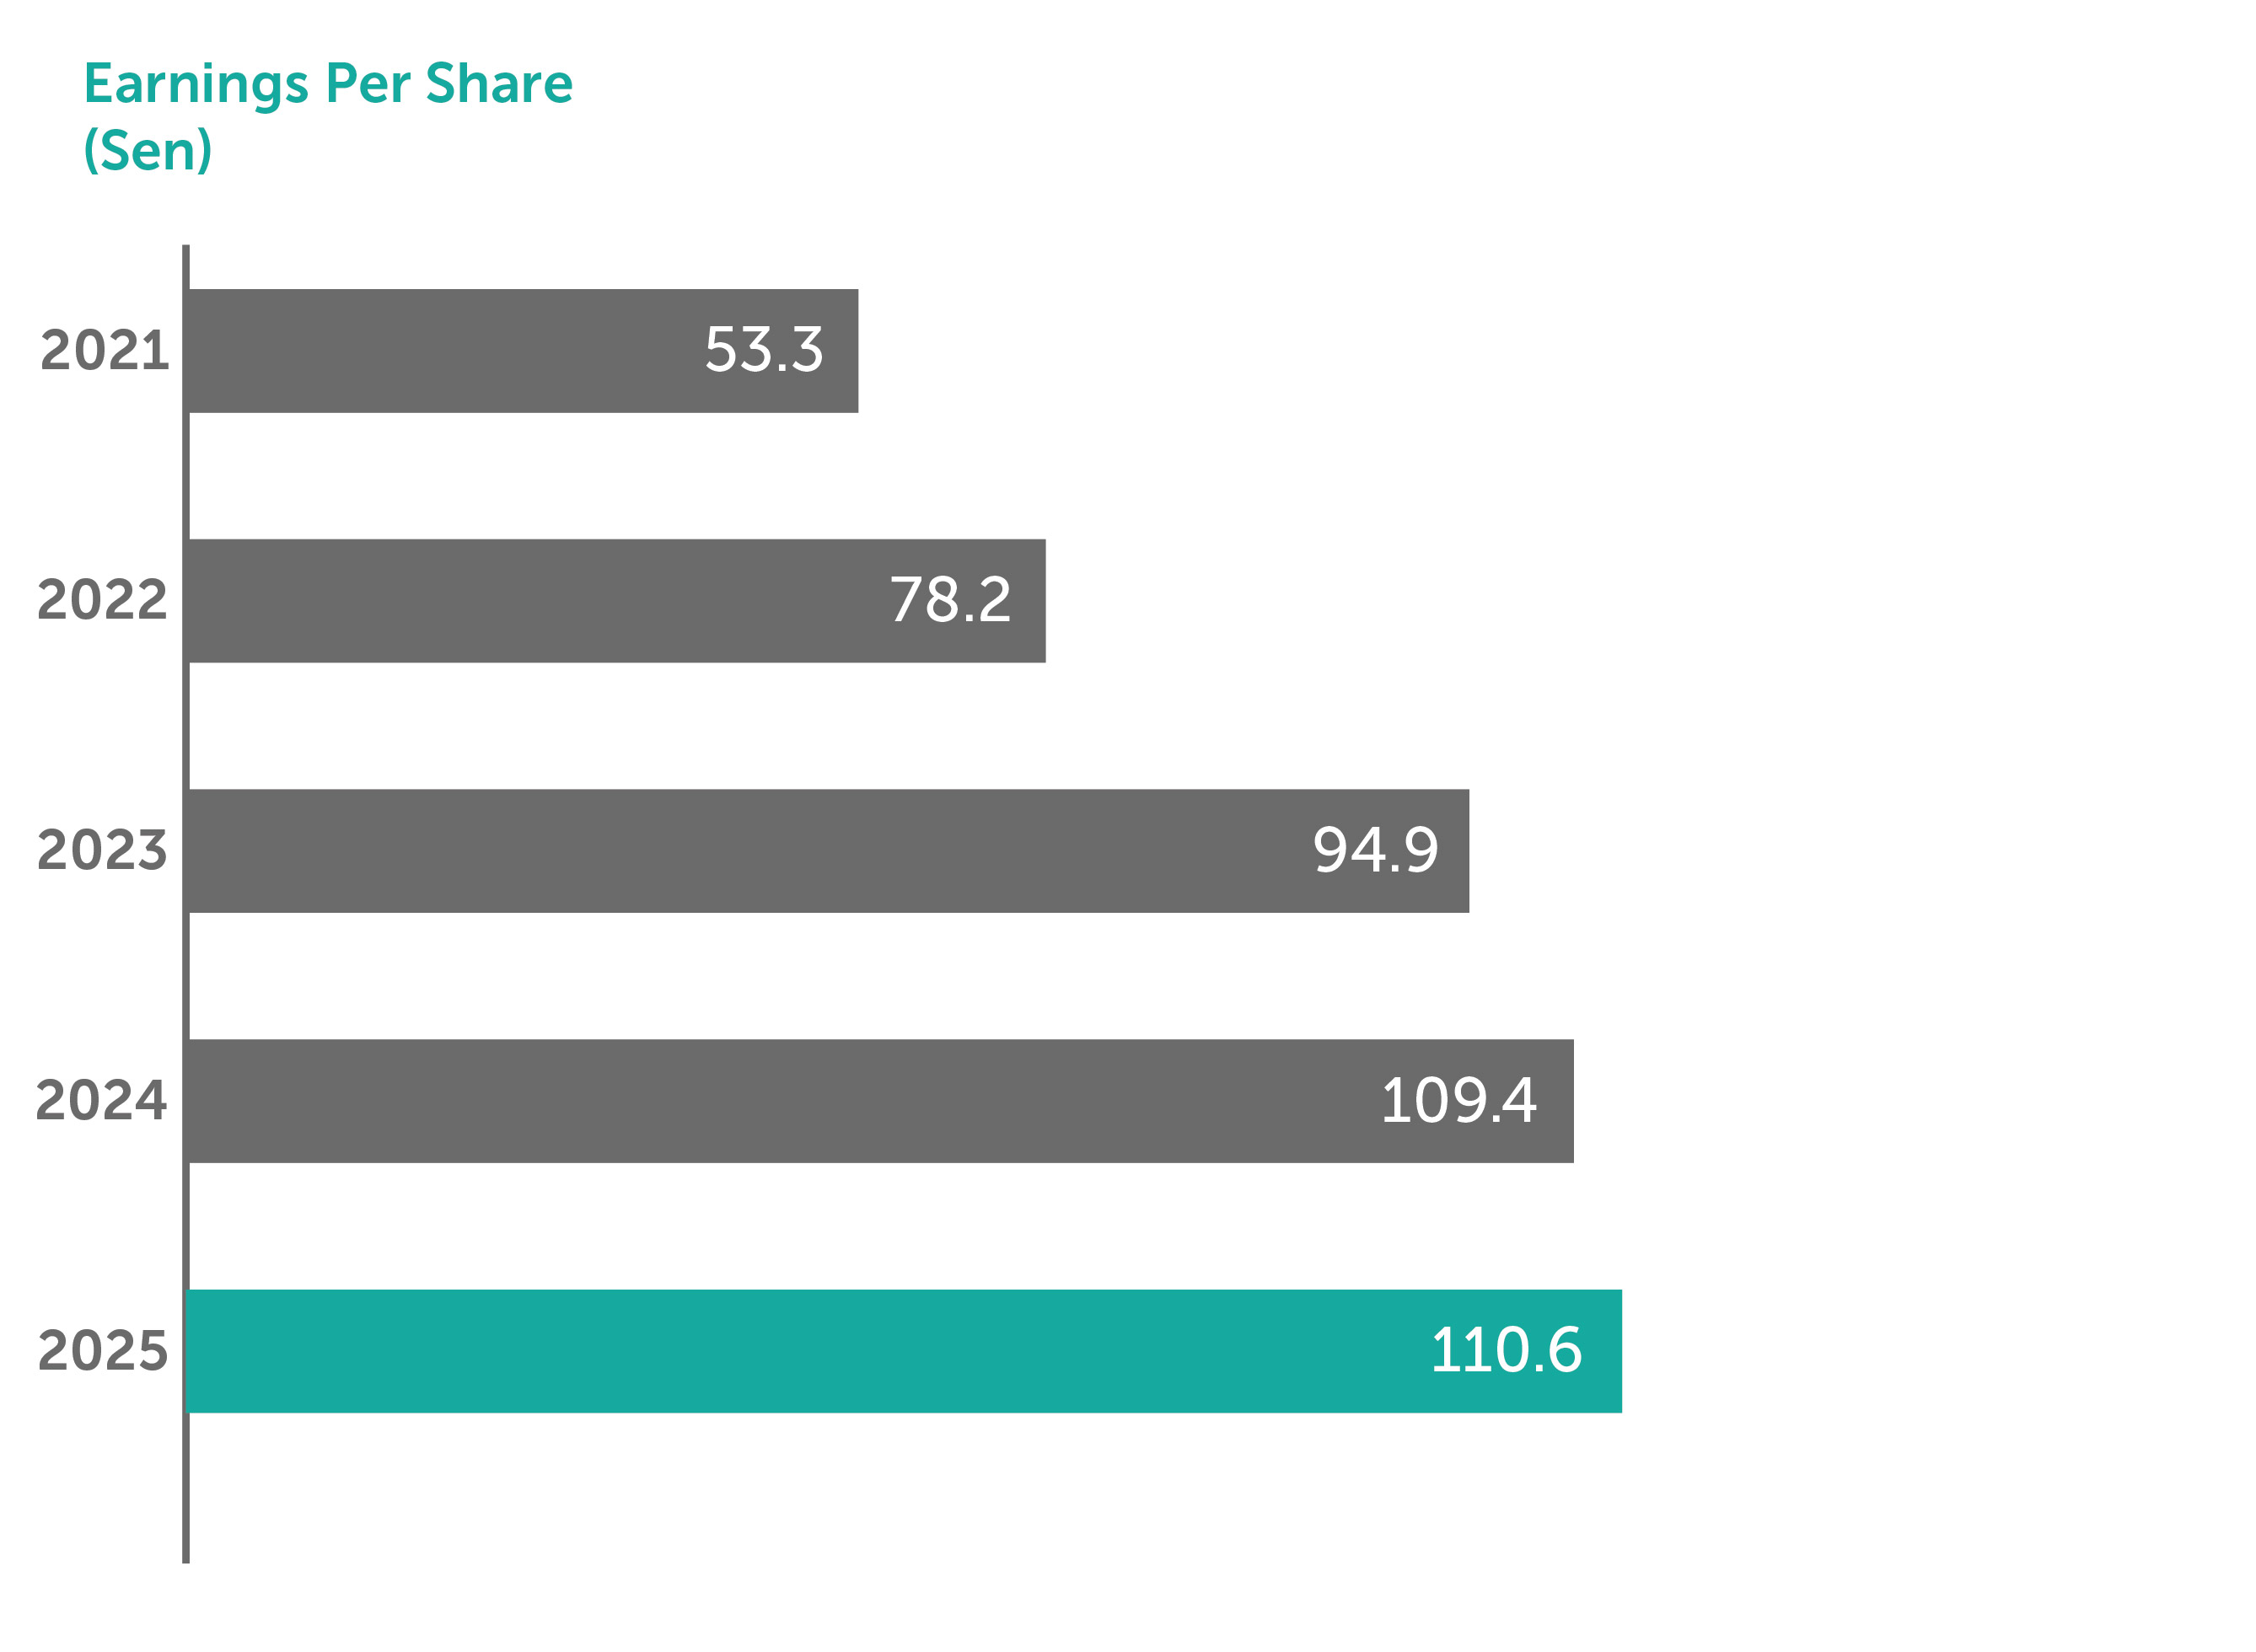
(RM Million)FY2021 FY2022 FY2023 FY2024 FY2025 Property, plant and equipment 4,018 4,115 4,117 3,995 4,117 Total Assets 9,601 11,258 11,487 11,116 11,084 Total Borrowings 116 184 152 108 163 Total Liabilities 3,985 5,470 5,650 5,047 5,032 Share Capital 993 993 993 993 993 Shareholders' Equity 5,582 5,743 5,768 5,971 5,967 Share Information (per share) FY2021 FY2022 FY2023 FY2024 FY2025 Basic earnings 53.3 sen 78.2 sen 94.9 sen 109.4 sen 110.6 sen Gross dividend 70.0 sen 76.0 sen 80.0 sen 107.0 sen 112.0 sen Share price as at financial year end (RM) 20.60 23.00 21.84 19.32 19.96 Financial Ratios (%) FY2021 FY2022 FY2023 FY2024 FY2025 Return on Total Assets 5.5 7.0 8.4 10.0 10.3 Debt to Equity Ratio 2.1 3.2 2.6 1.8 2.7 Dividend Payout Ratio 102.0 100.0 91.0 100.0 100.0