Operating Results (RM Million) | FY2015 | FY2016 | FY2017 | FY2018 | FY2019 | ||
|---|---|---|---|---|---|---|---|
| 28-Dec-20 | 21.10 | 21.30 | 21.10 | 21.22 | - | - | 0.05 |
| 29-Dec-20 | 20.92 | 21.34 | 20.92 | 21.30 | 0.08 | 0.38 | 0.16 |
| 30-Dec-20 | 21.38 | 21.40 | 21.04 | 21.40 | 0.10 | 0.47 | 0.15 |
| 31-Dec-20 | 21.38 | 21.40 | 21.04 | 21.40 | - | - | 0.16 |
| 1-Jan-21 | Public Holiday in Conjunction with New Year | ||||||
Operating Results (RM Million) | FY2020 | FY2021 | FY2022 | FY2023 | FY2024 |
|---|---|---|---|---|---|
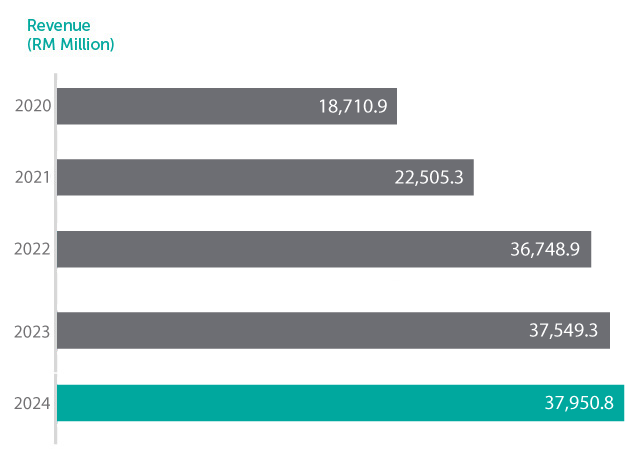
| Revenue | 18,711 | 22,505 | 36,749 | 37,549 | 37,951 |
| Operating Profit | 403 | 751 | 1,149 | 1,351 | 1,548 |
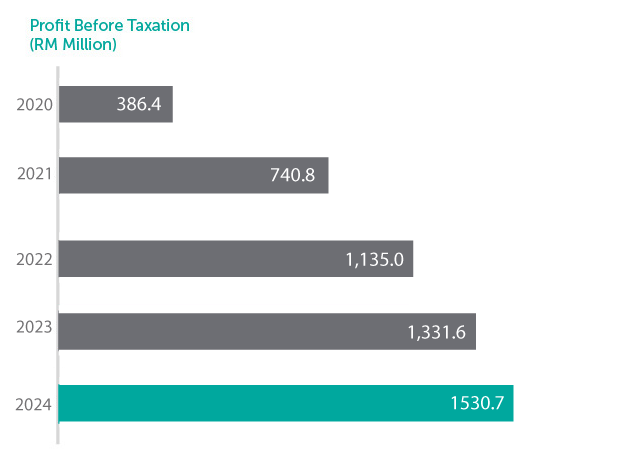
| Profit before taxation | 386 | 741 | 1,135 | 1,332 | 1,531 |
| Net profit attributable to shareholders of the Company | 276 | 530 | 777 | 943 | 1,087 |
Key Statement of Financial Position Data (RM Million) | FY2020 | FY2021 | FY2022 | FY2023 | FY2024 |
|---|---|---|---|---|---|
| Property, plant and equipment | 4,067 | 4,018 | 4,115 | 4,117 | 3,995 |
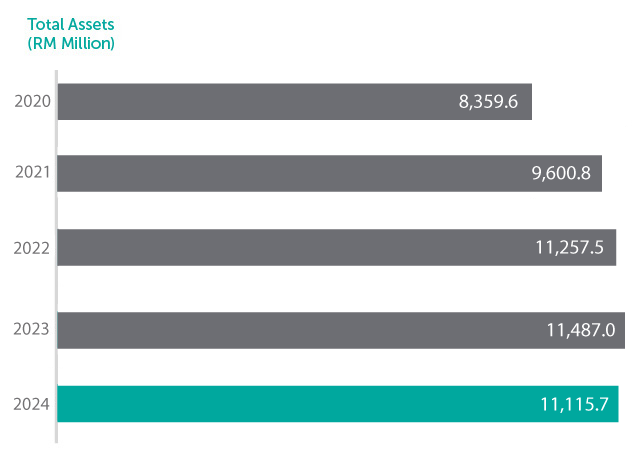
| Total Assets | 8,360 | 9,601 | 11,258 | 11,487 | 11,116 |
| Total Borrowings | 178 | 116 | 184 | 152 | 108 |
| Total Liabilities | 2,684 | 3,985 | 5,470 | 5,650 | 5,047 |
| Share Capital | 993 | 993 | 993 | 993 | 993 |
| Shareholders' Equity | 5,644 | 5,582 | 5,743 | 5,768 | 5,971 |
Share Information (per share) | FY2020 | FY2021 | FY2022 | FY2023 | FY2024 |
|---|---|---|---|---|---|
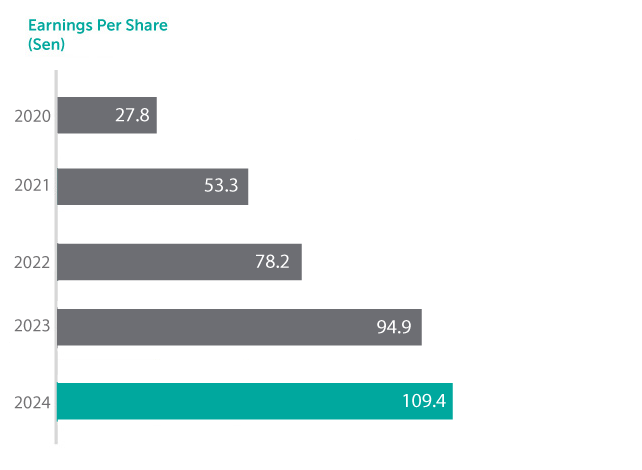
| Basic earnings | 27.8 sen | 53.3 sen | 78.2 sen | 94.9 sen | 109.4 sen |
| Gross dividend | 38.0 sen | 70.0 sen | 76.0 sen | 80.0 sen | 107.0 sen |
| Share price as at financial year end (RM) | 21.40 | 20.60 | 23.00 | 21.84 | 19.32 |
Financial Ratios (%) | FY2020 | FY2021 | FY2022 | FY2023 | FY2024 |
|---|---|---|---|---|---|
| Return on Total Assets | 3.3 | 5.5 | 7.0 | 8.4 | 10.0 |
| Debt to Equity Ratio | 3.1 | 2.1 | 3.2 | 2.6 | 1.8 |
| Dividend Payout Ratio | 96.0 | 102.0 | 100.0 | 91.0 | 100.0 |